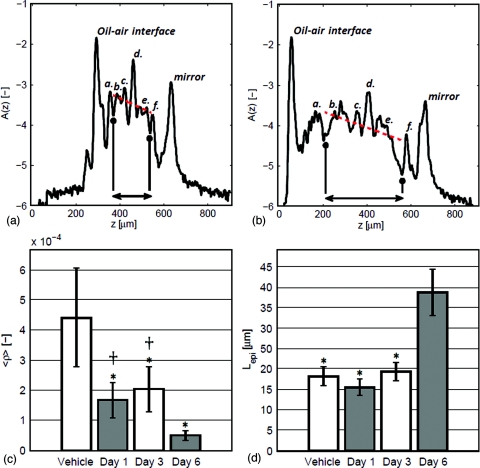
Figure 2.
Quantitative appraisal of IMQ induced skin reorganization using OCT axial scans. Axial profile (log base 10 scale) of (a) control and (b) 6-day IMQ treated DBA2∕C57BL6 mouse ears. Arrows in (a) and (b) denote the upper and lower dermis of the ear, utilized in the parametric fit (dotted line) of the form ρ exp ( − μz). (c) Bar graph indicating the decrease of the ensemble averaged dermal reflectivity, ⟨ρ⟩, in response to daily IMQ treatment in mouse ear. (*) indicates p < 0.05 in comparison to control, (†) indicates p < 0.05 in comparison to 6-day IMQ treatment. (d) Bar graph indicating epidermal thickness, (*) indicates p < 0.05 in comparison to 6-day IMQ treated ears. In panels (a) and (b): (a,f ) denotes the stratum corneum; (b,e) denote the dermis; (c,d ) denote the borders of the cartilage layer running through the center of the ear.

