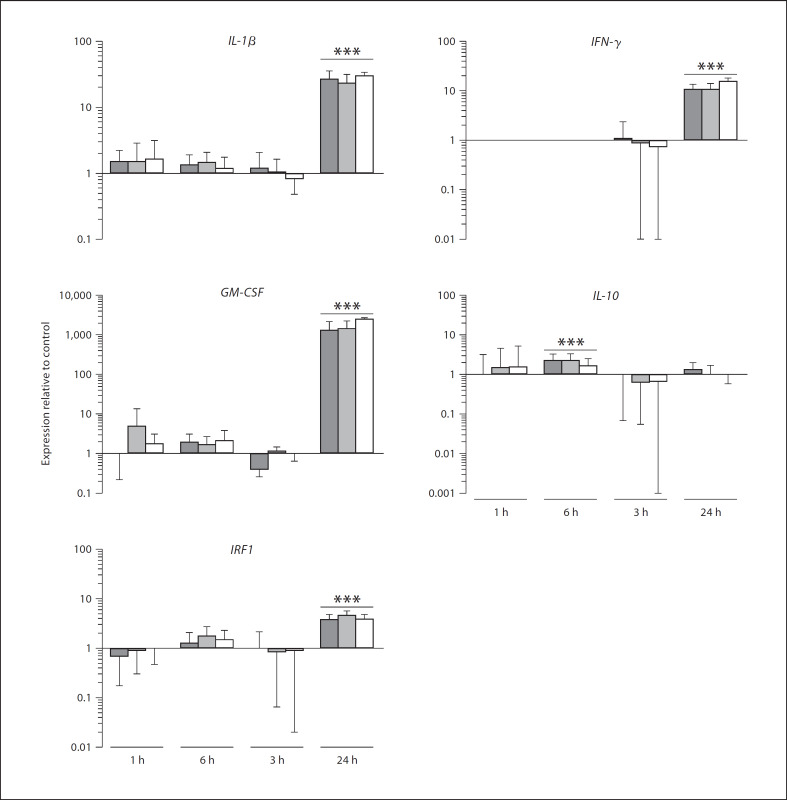
Fig. 1.
Analysis of IL-1β, IFN-γ, GM-CSF, IL-10 and IRF1 expression in THP-1 cells in response to stimulation with 2.5 nM active HRgpA (dark bars), 2.5 nM inactive HRgpA (grey bars) or 2.5 nM active Kgp (clear bars) for 1 h. cDNA synthesized from RNA extracted immediately (1 h) or 3, 6 or 24 h later from THP-1 cells challenged with each treatment was used as a template for qPCR reactions using IL-1β, IFN-γ, GM-CSF, IL-10, IRF1 and GAPDH primers. The cycle threshold values were used to calculate IL-1/β, IFN-γ, GM-CSF, IL-10 and IRF1 transcript levels in treated cultures normalized to GAPDH relative to the normalized level of the transcripts for the same molecules in untreated samples. Data are presented as means ± SEM (n = 3). *** p ≤ 0.001. Comparisons between 2 groups were made by unpaired Student's t tests.

