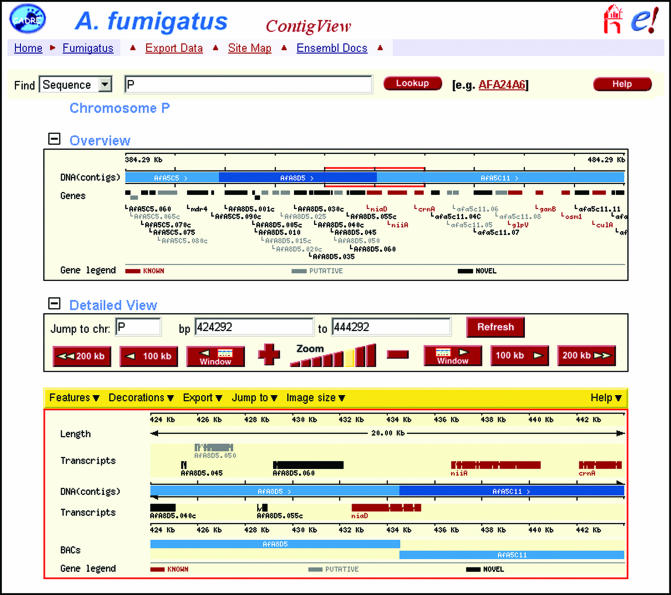
Figure 1.
Screenshot of ContigView. A region of 100 kb around the niaD locus is shown in the top panel (or ‘Overview’); names for all predicted genes within that region of the assembly are also displayed. A region of 20 kb around the niaD locus is shown in the bottom panel (or ‘Detailed View’); names and structures of all predicted transcripts within that region of the assembly are also displayed. In both panels, transcripts are colour-coded according to their classification: i.e. known, red; putative, grey; and novel, black. Each transcript is labelled with its standard name, if known; otherwise the systematic name is used.

