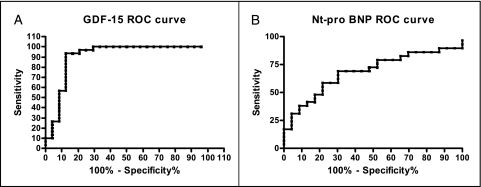
Figure 4.
ROC curves were generated to determine clinically relevant plasma levels of GDF-15 and NT-proBNP, optimizing sensitivity and specificity. A, An ROC curve for GDF-15 (area under the curve [AUC] = 0.91, P < .0001). B, An ROC curve for NT-proBNP (AUC = 0.69, P = .023). ROC = receiver operating characteristic. See Figure 1 and 2 legends for expansion of other abbreviations.

