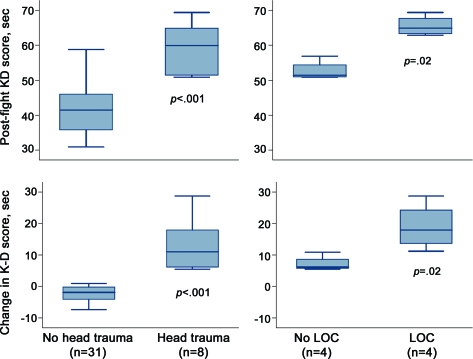
Figure 2. Box plots show the distributions of postfight King-Devick (K-D) time scores and changes in scores from prefight to postfight in participants with vs without head trauma or loss of consciousness (LOC).
The lines in the box represent the medians, and boxes delineate the interquartile range (25th–75th percentiles). Whiskers represent the range of observations minus outliers (no outlier values in this sample). p Values are based on Wilcoxon rank sum test with exact variances comparing groups with head trauma vs no head trauma and LOC vs no LOC.

