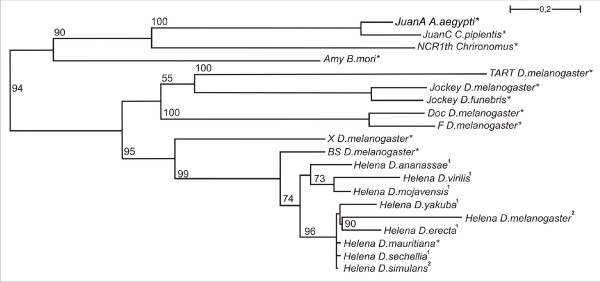
Figure 4.
Phylogenetic tree of RT proteins. The reconstruction was performed by the maximum likelihood method with the LG model, using the Helena reference copies obtained in this study and other LINE elements based on their partial reverse transcriptase domains. The sequences used were obtained from GenBank, and are identified by the TE name and the host names (* Sequences obtained from GenBank; 1Sequences obtained in this study; 2Helena sequences obtained by Rebollo et al. [18)]. The numbers indicate the branch support calculated by bootstrap analysis consisting of 100 replicates. Only bootstrap values greater than 50% are indicated.

