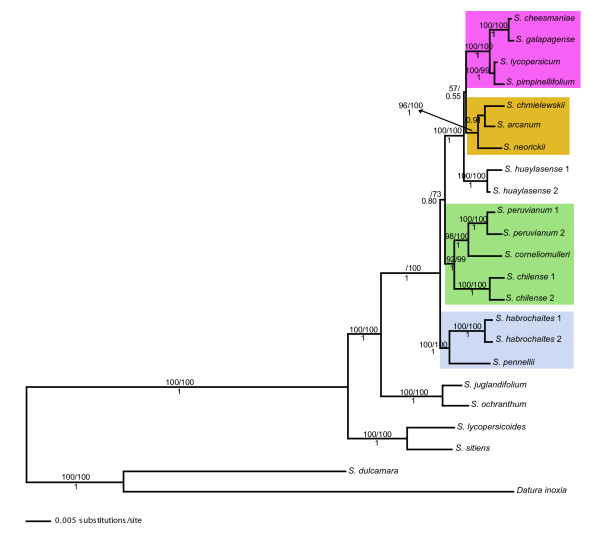
Figure 3.
Tomato Bayesian phylogram based on a combined analysis of 18 COSII sequences. Datura inoxia and S. dulcamara were used as outgroups. Numbers after the species name indicate allelic variants. Support values are placed as in Figure 1. Clades with many species have a background for helping follow the results and discussion.

