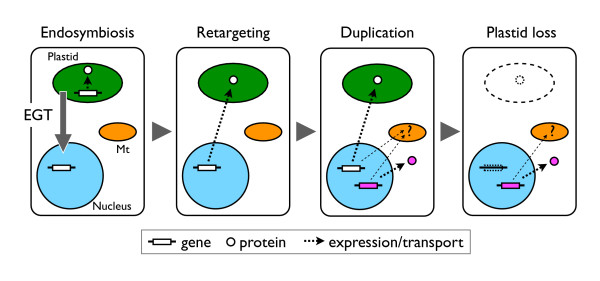
Figure 6.
An evolutionary history of the genes with cyanobacterial ancestry. Thick continuous arrows represent gene flow via EGT. Thin broken arrows indicate gene expression or intracellular transport into organelles. Dashed line circles and boxes indicate that they have been lost in the evolutionary history. Note that the genes with cyanobacterial ancestry (white), which had been derived from the plastid genome via EGT, were retargeted into the plastid. After rounds of gene family duplication, some genes (magenta) gained additional functions in other cellular compartments (cytosol, mitochondrion, etc.). In some plastid-lacking protists, a number of genes were retained in the nuclear genomes after the plastid loss events. Mt, mitochondrion.

