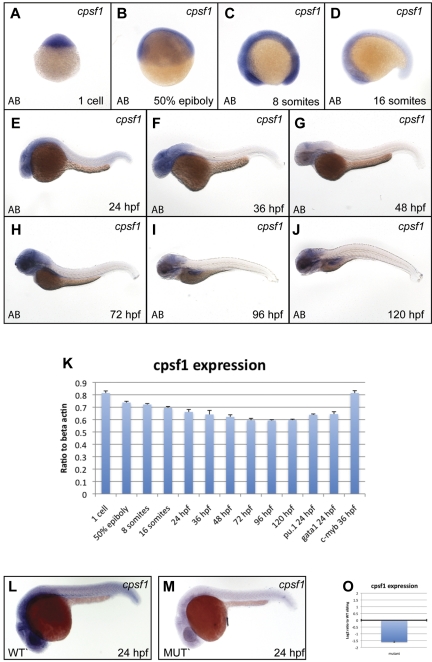
Figure 4.
cpsf1 expression in normal embryos and grechetto mutants. (A-J) Lateral views of normal AB zebrafish embryos stained with a cpsf1 WISH probe at the 1-cell stage (A), 50% epiboly (B), 8 somites (C), 16 somites (D), 24 hpf (E), 36 hpf (F), 48 hpf (G), 72 hpf (H), 96 hpf (I), and 120 hpf (J). (K) qRT-PCR in cDNA from embryos at the same stages as in panels A through J showing expression levels of cpsf1 as a linear ratio to β-actin expression at each stage. In the 3 right columns, cpsf1 expression was probed in pu.1:EGFP- and gata1:DsRed–sorted cells from 24 hpf embryos and in c-myb:EGFP cells sorted at 36 hpf, demonstrating expression in the developing primitive and definitive hematopoietic system. Bars represent the average of triplicate runs and error bars represent SEM. (L-M) Lateral views, anterior to the left, dorsal upward of WISH staining for cpsf1 in 24 hpf genotyped grechetto mutants (M) and WT siblings (L) showing decreased expression in the former. (O) qRT-PCR for cpsf1 expression in mutants compared with their WT siblings at 72 hpf is shown in a log2 y-axis normalized for ef1a expression.

