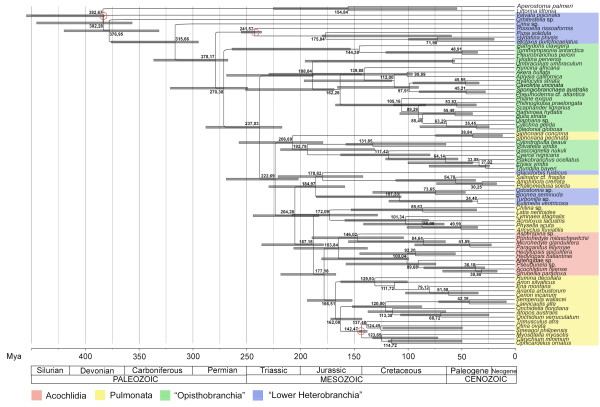
Figure 2.
Chronogram of Heterobranchia. Showing estimated divergence times obtained from BEAST v1.5.3 under the uncorrelated lognormal relaxed clock model. Numbers at nodes refer to node ages in this presented tree (maximum-clade-credibility-tree); bars express 95% highest posterior density (HPD) (only presented for nodes with a PP > 0.5). Red circles indicate calibration points. Geological timescale is based on the International Stratigraphic Chart by the International Commission on Stratigraphy (2009).

