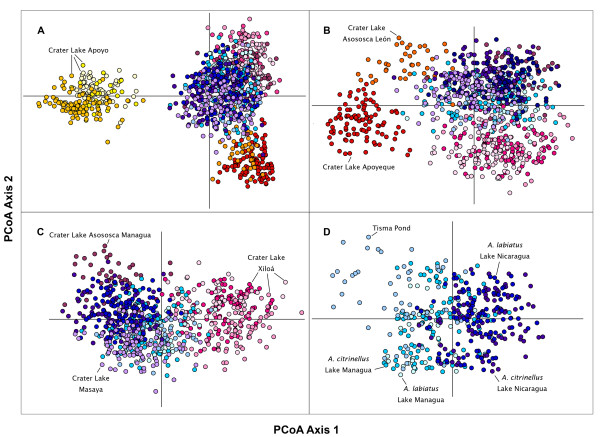
Figure 3.
Plot of the two first axes of the Principal coordinate analyses (PCoA). Each circle represents a single individual and colors reflect species and lake of origin. A. Analysis including all sampled populations (PCoA1 = 44.71%, PCoA2 = 16.54%). B. Analysis excluding the populations from crater Lake Apoyo (PCoA1 = 27.49%, PCoA2 = 20.39%). C. Analysis excluding samples from crater lakes Apoyo, Apoyeque and Asososca León (PCoA1 = 24.67%, PCoA2 = 19.65%). D. Analysis including the samples from the large lakes and Tisma Pond (PCoA1 = 24.04%, PCoA2 = 19.03%).

