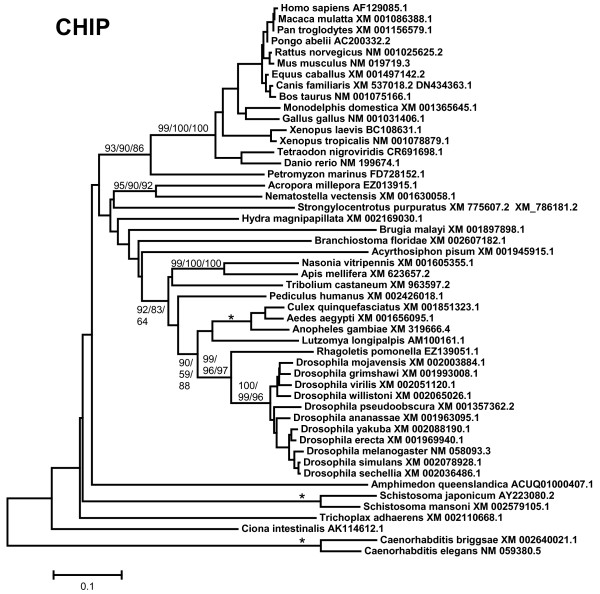
Figure 2.
Chip proteins in animals. The phylogram indicates the species and accession numbers of the corresponding Chip sequences. Notice the high divergence of the Caenorhabditis sequences, discussed in the main text. Bootstrap support, in percentage, is indicated. The numbers respectively correspond to the bootstrap results for the NJ, MP and ML methods of phylogenetic reconstruction (see Material and methods; they are indicated as NJ/MP/ML, around the corresponding branches). In this and the following figures, asterisks indicate 100% bootstrap support according to the three methods. Values have been shown only when at least two of the three percentages were above 50%. Also, for simplification, bootstrap support for external branches (e. g. within mammals or for Drosophila species) is not detailed in this or the following trees.

