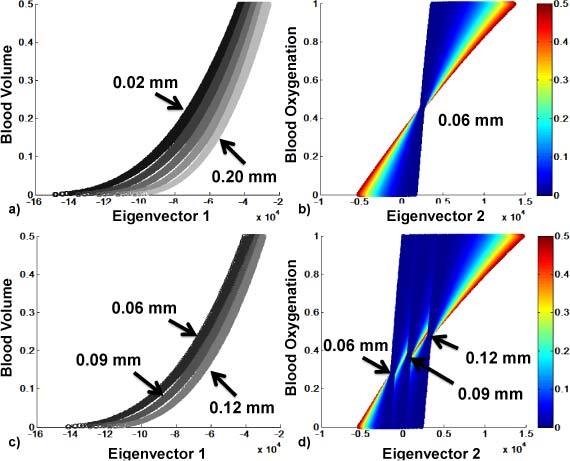
Fig. 3.

Eigenvector 1 and 2 vs. blood volume and blood oxygenation, respectively. 3a and 3b show results for the uniform thickness set; 3c and 3d for spatially varying thickness set. 3a and 3c show results color-coded with thickness d; 3b shows one wavelength set of uniform thickness of 0.06mm; 3d shows a wavelength set of varying thickness; 3b and 3d are color-coded with blood volume, showing the dependence of eigenvector 2 on blood volume as well as on thickness.
