Fig. 11.

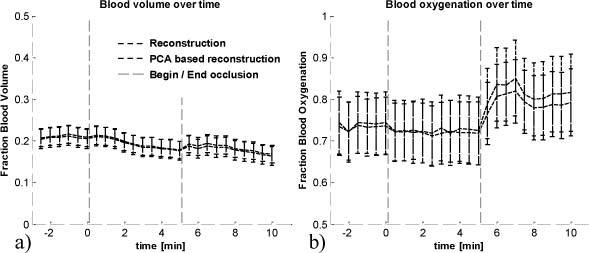
Blood volume (a) and oxygenation (b) over time, extracted with two-layered reconstruction and PCA based reconstruction. Begin and end of occlusion is indicated by the vertical lines at time t = 0min and t = 5min.

Blood volume (a) and oxygenation (b) over time, extracted with two-layered reconstruction and PCA based reconstruction. Begin and end of occlusion is indicated by the vertical lines at time t = 0min and t = 5min.