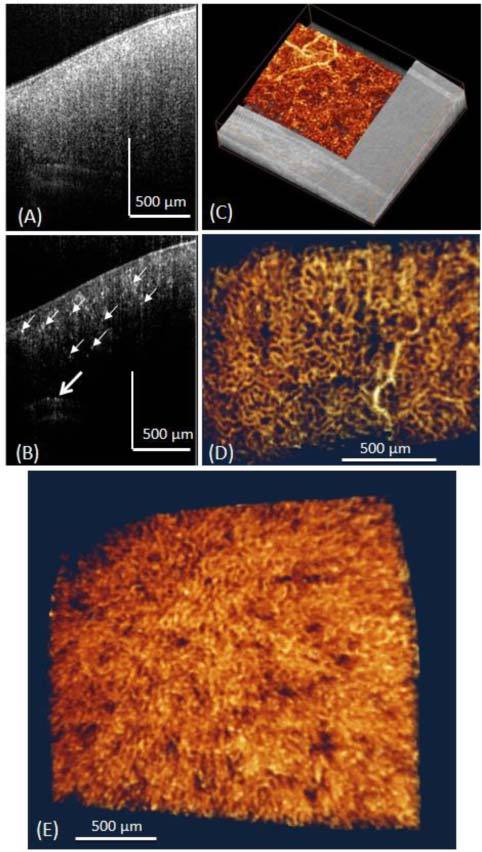
Fig. 2.

Typical in vivo UHS-OMAG imaging results of the renal microcirculation in adult mouse. (A) Shows one typical cross-sectional OCT image of the mouse kidney structure, and (B) is corresponding UHS-OMAG blood flow image of (A). Small white arrows point to the small capillaries and the open arrow points the arcuate artery. (C) 3D merged structure and volumetric perfusion image, (D) Microvasculature image showing the arterioles and peritubular capillary network. (E) 3D rendered angiogram of cortical microvasculature from the top view.
