
Fig. 5.
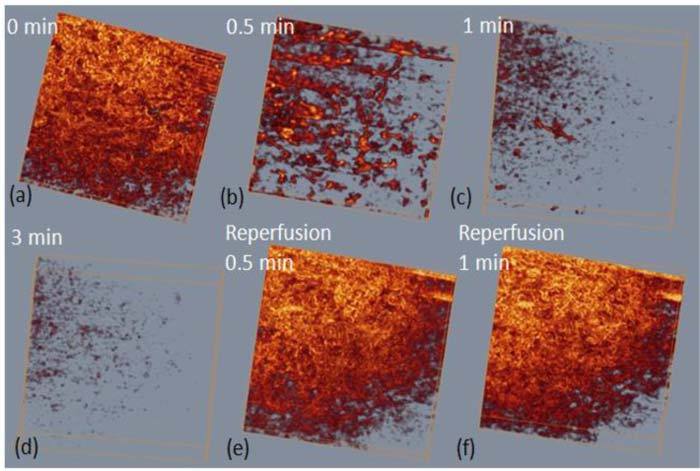
Representative 3D renal microcirculation perfusion maps show the process of renal ischemia and reperfusion. The imaged region shown here is ~1.5 x 1.5 mm2.
Official websites use .gov
A
.gov website belongs to an official
government organization in the United States.
Secure .gov websites use HTTPS
A lock (
) or https:// means you've safely
connected to the .gov website. Share sensitive
information only on official, secure websites.
Representative 3D renal microcirculation perfusion maps show the process of renal ischemia and reperfusion. The imaged region shown here is ~1.5 x 1.5 mm2.