
Fig. 6.
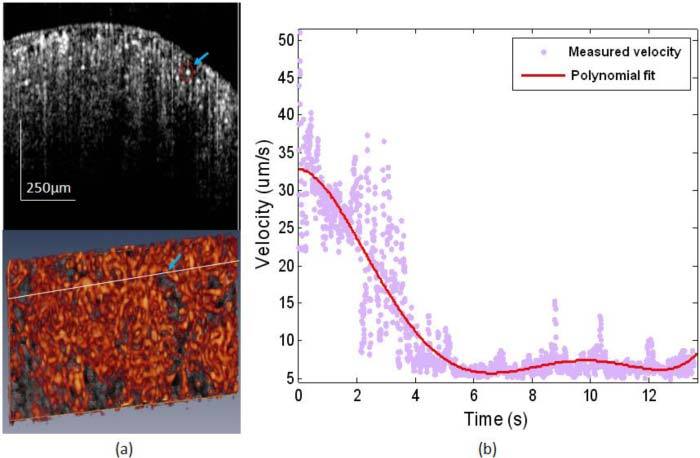
(a) Cross-sectional blood flow image (upper) showing the capillary vessel used for velocity evaluation as located by the circle and arrow. This capillary vessel was also pointed out in the bottom 3D capillary map. (b) Blood flow velocity change of the single capillary vessel pointed out in (a) during the process of renal ischemia.