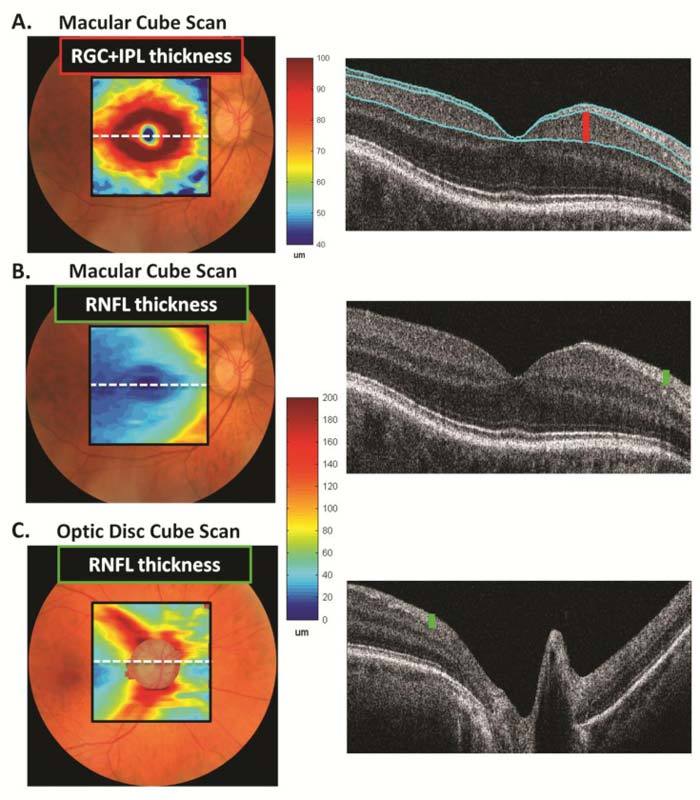
Fig. 1.

Sample thickness maps and scans from a healthy control. A. RGC + IPL thickness map (left) and a scan through the horizontal meridian with the segmentation displayed in light blue (right). B. RNFL thickness map (left) and a scan through the horizontal meridian (right). C. RNFL thickness map (left) and a scan through the center of the optic disc (right).
