
Fig. 1.
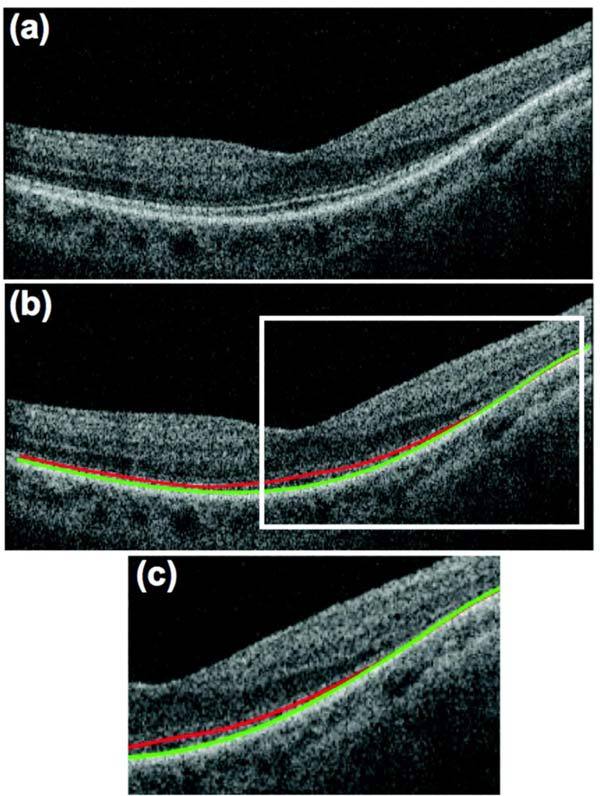
fdOCT scan through the horizontal meridian of P1. (a) Scan before segmentation. (b) Scan after segmentation of IS/OS (red) and OS/RPE (green) boundaries. (c) Expanded view of portion within white rectangle in panel (b).
Official websites use .gov
A
.gov website belongs to an official
government organization in the United States.
Secure .gov websites use HTTPS
A lock (
) or https:// means you've safely
connected to the .gov website. Share sensitive
information only on official, secure websites.
fdOCT scan through the horizontal meridian of P1. (a) Scan before segmentation. (b) Scan after segmentation of IS/OS (red) and OS/RPE (green) boundaries. (c) Expanded view of portion within white rectangle in panel (b).