
Fig. 2.
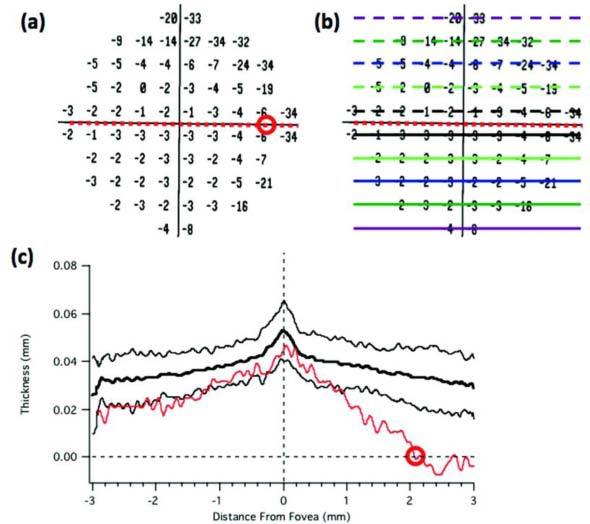
An illustration of the procedure for estimating the end of the IS/OS border using the horizontal scan for P1 shown in Fig. 1. (a) The 10-2 total deviation plot. (b) Same as panel A with the location of the scans segmented. (c) The thickness of the OS layer as a function of distance across the scan shown in Fig. 1. The dashed lines indicate zero OS thickness (horizontal) and the center of the fovea (vertical).