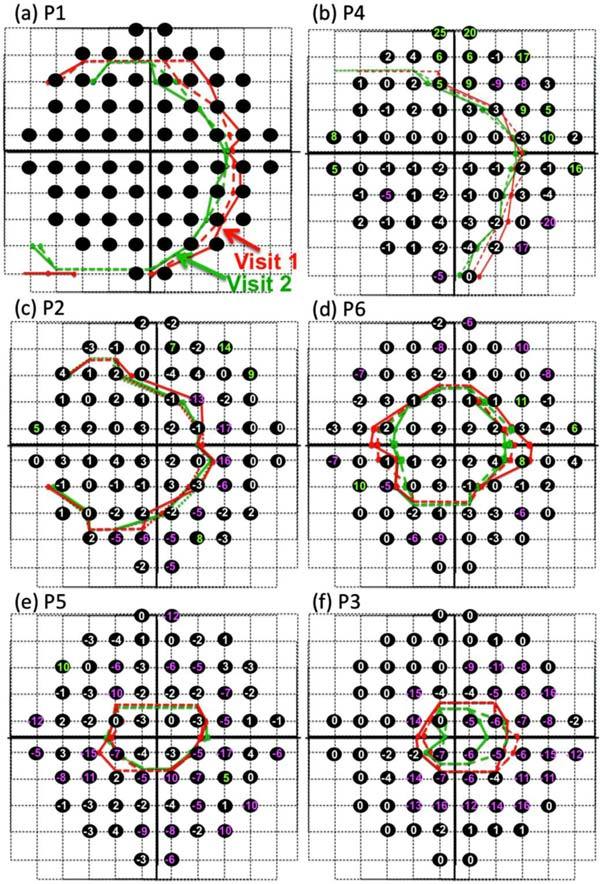
Fig. 4.

Repeat measures within and across sessions. In each panel, the red and green curves show the 2 scans performed on the first (red) and second (green) visits. Black circles indicate the location of the 10-2 points and the numbers (in dB) show the change in field sensitivity (in dB) between the 2 visits (visit 2-visit 1).
