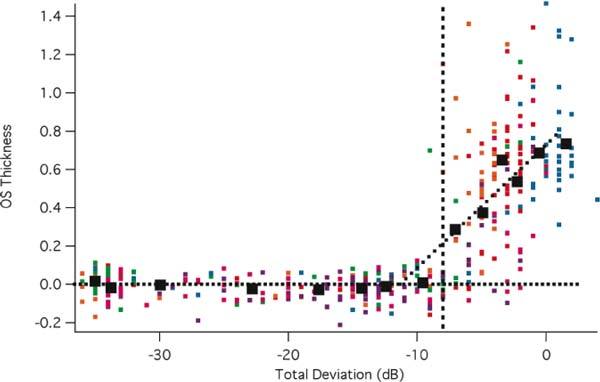
Fig. 5.

OS thickness versus field loss. The thickness of the OS at each point in the visual field is shown for individual patients (small symbols) as a function of the field loss at that point. The large symbols are the means of the data grouped into equal sized bins.
