
Fig. 5.
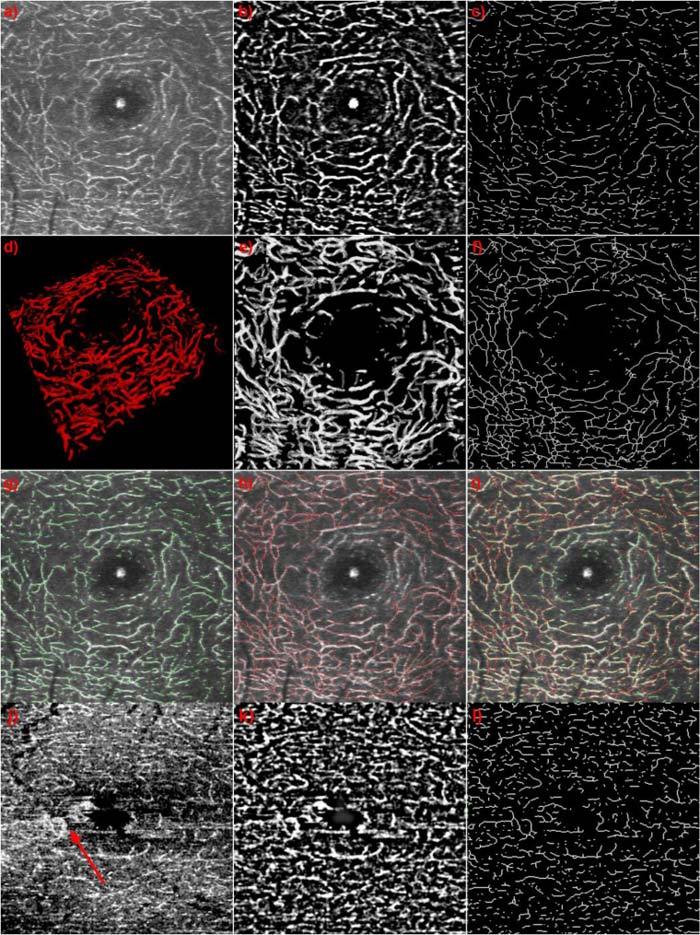
(a) Maximum intensity projection of the INL; (b) Result of band pass filtering (a). (c) Skeleton of (b). (d) 3D view of the annotation of the INL capillaries of the same data set. (e) Maximum intensity projection of (d). (f) Skeleton of (e). (g) Overlay of (a) and (c). (h) Overlay of (a) and (f). (i) Overlay of (a), (c) and (f). (j) maximum intensity projection of S2 of a diseased eye suffering from telangiectasia. (k) Result of band pass filtering (j). (l) Skeleton of (j). Red arrow indicates area of leakage.