
Fig. 2.
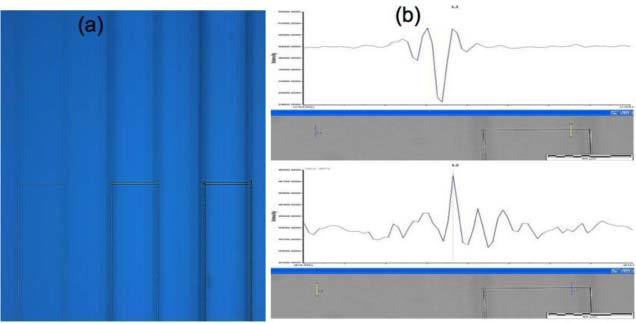
a) Microscope image of three pairs of lines showing a variation in the feature width with varying inscription power b) QPm measurements of two lines showing the contrast between above material threshold void creation (above) and below material threshold index change. The yellow line in the grey image marks the measurement area for relative phase plot.