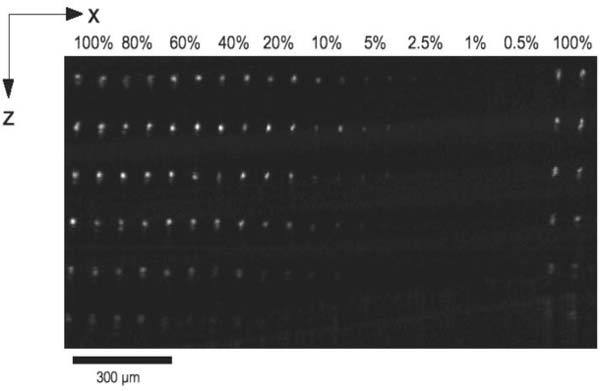
Fig. 4.

OCT cross-section of engraved sample, scaled in logarithmic intensity. Lateral and axial dimensions are denoted x and z respectively. Femtosecond inscription is denoted by the bright points. Rows and columns were written at 75μm intervals. At each depth, pairs of lines were written at laser powers varying from 0.5 to 100%. The OCT image has not been corrected for the silica substrate refractive index.
