
Fig. 3.
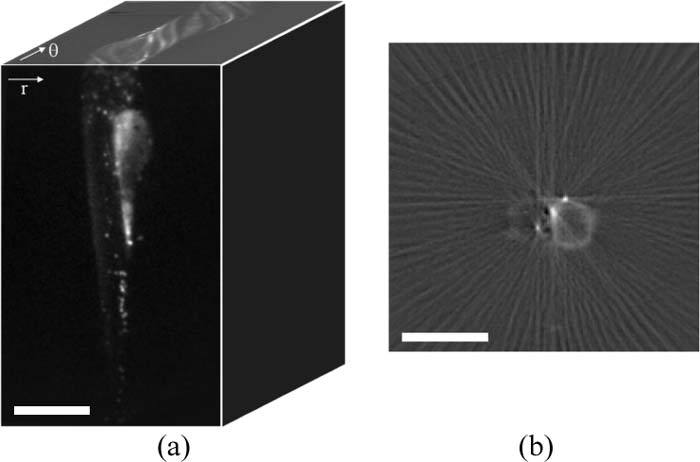
(a) An OPT raw data set comprises a set of wide-field images as a function of rotation. Reconstruction is performed using the sinograms (r-θ planes) for each row of pixels. (b) Single frame showing the reconstruction of a single slice from 90 fluorescence projections (Media 3 (468.8KB, AVI) ). Scale bar 500 μm.