
Fig. 4.
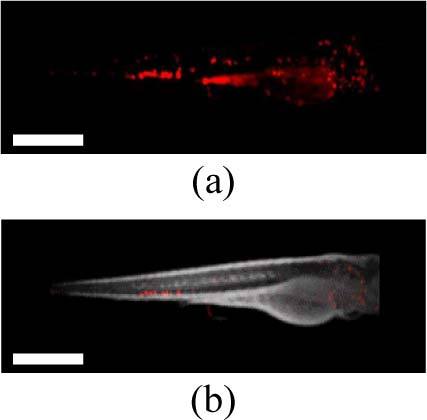
(a) A 3-D fluorescence intensity reconstruction and (b) a single frame showing combined fluorescence (red) and transmitted light (grey) intensity reconstructions of a live lysC:GFP transgenic zebrafish embryo 3 days post-fertilization (Media 4 (299.5KB, AVI) ). Scale bar 500 μm.