
Fig. 5.
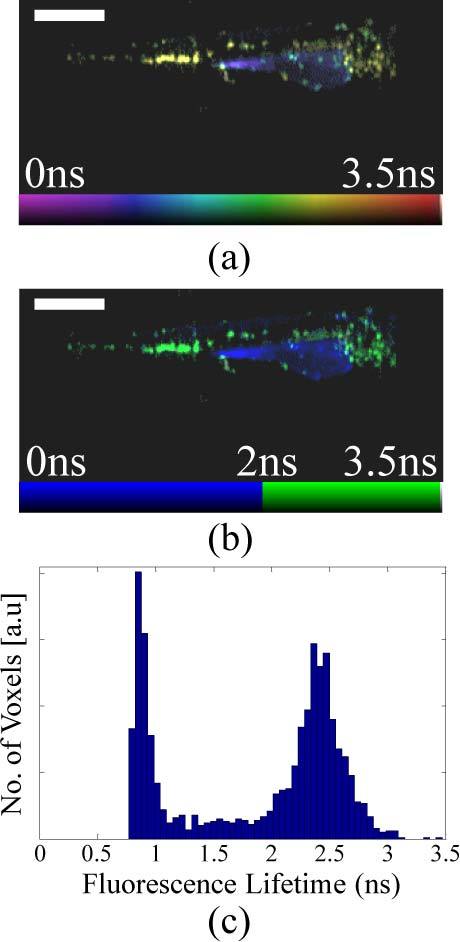
Single frames showing 3-D fluorescence lifetime reconstructions on a (a) continuous (Media 5 (328.7KB, AVI) ) and (b) discrete color scale (Media 6 (328.9KB, AVI) ) of a live lysC:GFP transgenic zebrafish embryo 3 days post-fertilization. (c) A fluorescence lifetime histogram showing two clear populations corresponding to GFP and autofluorescence. Scale bar 500 μm.