Fig. 3.

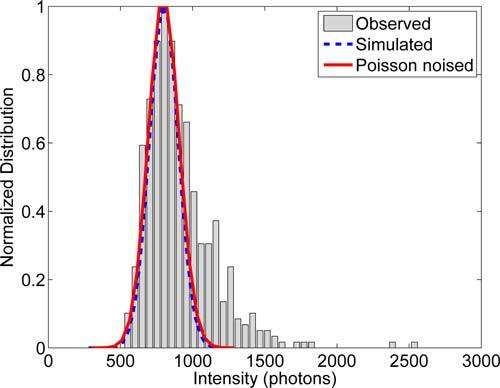
Single fluorophore intensity distribution of the organic fluorophore Alexa Fluor 647 obtained from the data set described in section 4.4.1 taken in TIRF condition. The distribution is modeled as a normal distribution with μ = 800, σ = 100.

Single fluorophore intensity distribution of the organic fluorophore Alexa Fluor 647 obtained from the data set described in section 4.4.1 taken in TIRF condition. The distribution is modeled as a normal distribution with μ = 800, σ = 100.