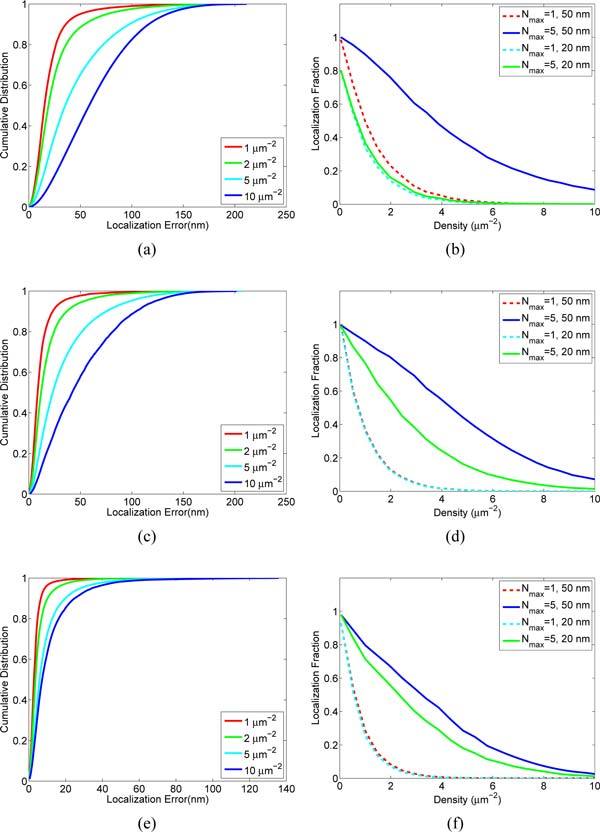
Fig. 5.

Performance versus active emitter density and intensity distribution. Shown are the results of MFA analysis of images with spatially random distributed emitters with normally distributed intensities of 300 ± 30 (a), (b), 800 ± 100 (c), (d), and 5000 ± 30 (e), (f). Localization error is calculated as the distance from the estimated position to the found position and in all cases assumes Nmax = 5. The median localization error is where the cumulative distribution reaches 0.5. Localization fraction is the fraction of emitters that are correctly localized as determined by being found within either 20 nm or 50 nm from the known position.
