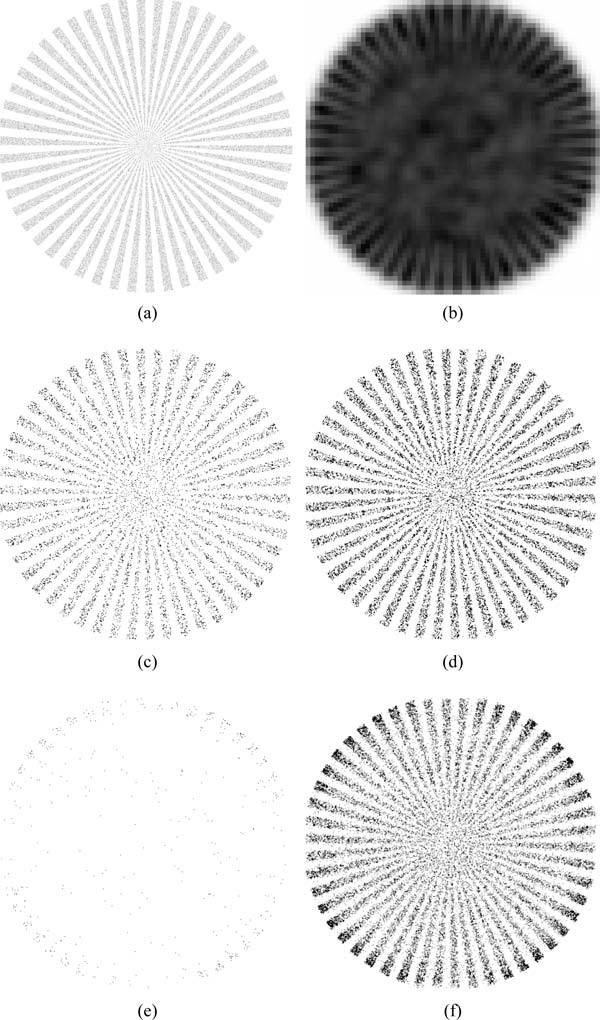
Fig. 6.

(a) The emitter position histogram used in generating synthetic data. (b) Sum projection of the generated image. (c) Single emitter fitting result at a density of 1 μm−2 with Nmax = 1. (d) Multiple emitter fitting result at a density of 1 μm−2 with Nmax = 5. (e) Single emitter fitting result at a density of 6 μm−2 with Nmax = 1. (f) Multiple emitter fitting result at a density of 6 μm−2 with Nmax = 5. At 1 μm−2 case, Nmax = 1 resulted in 12848 emitters localized while Nmax = 5 localized 30354 emitters. While in 6 μm−2 case, Nmax = 1 resulted in 519 emitters localized while Nmax = 5 localized 33580 emitters. The contrast of images (c) to (f) were globally adjusted across all images for optimal display.
