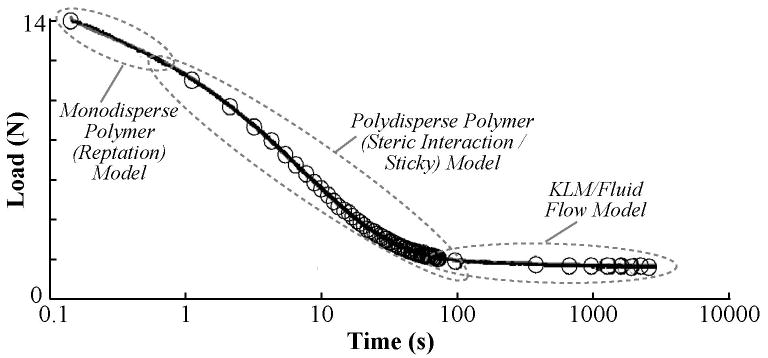
Figure 5.
Polymer models fit short-term and fluid-flow models fit long-term cartilage stress-relaxation. Example of total curve fit to stress relaxation data. Circles represent data downsampled by 200, and line represents the total model including both polymer (stretched exponential) and fluid flow (KLM) terms. The majority of load relaxation occurred in the first 100 seconds of relaxation and was associated with polymer mechanics models, with the initial (0-0.2 s) relaxation best fit by monodisperse reptation and the subsequent portion (0.2-100 s) best fit by the stretched exponential. The temporal majority of the data (∼100-1700 s) was fit by the fluid-flow model.

