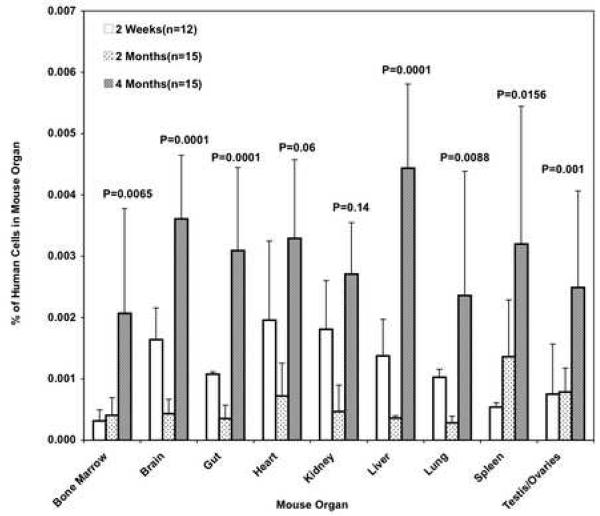
Fig 3. hBOEC expansion in 9 organs at 2 wks, 2 months and 4 months.
8×10⁵ hBOEC /mouse/day were tail-vein injected into NOD/SCID mice on 3 consecutive days. Organs were harvested at 2 wks, 2 months, and 4 months and analyzed by real-time qPCR (12-15 mice per group). Data represents % hBOEC per total cells per organ. Error bars represent S.D. P-values are for 2 wks versus 4 months. One experiment.

