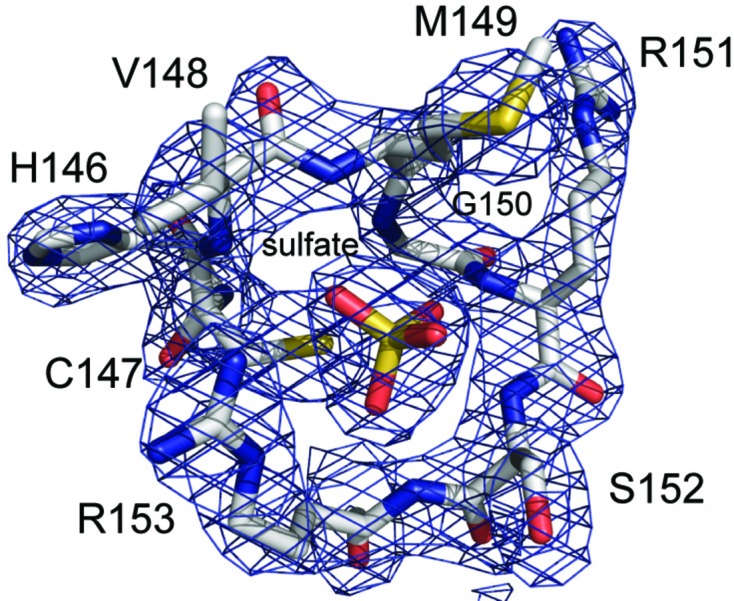
Figure 4.

The σA-weighted 2mF o − DF c electron-density map (2.38 Å resolution, contoured at the 1.5σ level) for the residues of the active-site phosphate-binding loop and bound sulfate ion. The residues are depicted in stick format with carbon in gray, nitrogen in blue, oxygen in red and sulfur in yellow.
