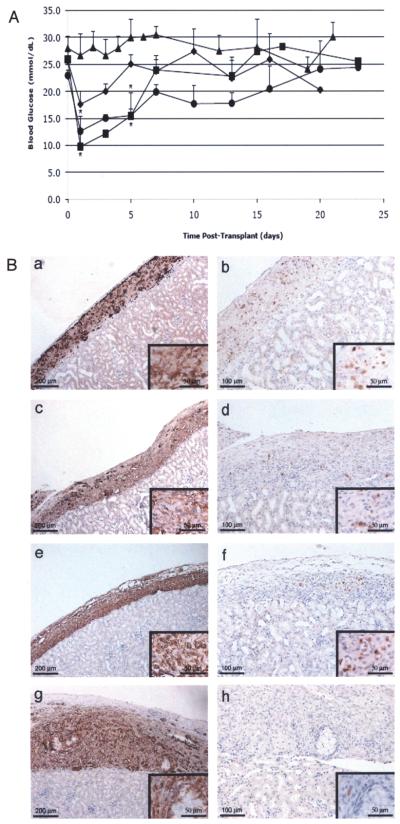
Figure 2.
Transplantation of insulin-expressing neonatal porcine Sertoli cells into diabetic SCID mice. (A) Average blood glucose values ± SEM of SCID mice after transplantation with 5 (filled diamonds; n = 5), 10 (filled circles; n = 4), or 20 (filled squares; n = 3) million insulin-expressing NPSC or 20 million (filled triangles; n = 4) GFP-expressing NPSC. NPSC were transduced with the AdCMVhInsM or AdRSVGFP adenoviral vector at a MOI of 100. *Mean blood glucose values were significantly decreased compared to the AdRSVGFP group values (p < 0.05). (B) Grafts were removed from SCID mice at 3 (a and b), 8 (c and d), 13 (e and f), and 30 (g and h) days after transplantation with NPSC and immunostained for the SC marker vimentin (column 1; a, c, e, and g) or insulin (column 2; b, d, f, and h). Higher magnification photomicrographs are included as insets (a–h). All sections were counterstained with hematoxylin.

