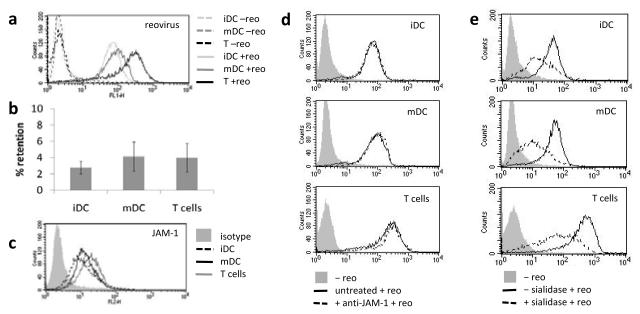
Figure 1.
(a) FACS analysis for reovirus retention on iDC, mDC and T cells, plots are representative of 4 independent experiments. (b) freeze/thaw preparations of reovirus loaded cells were used in a standard plaque assay and reovirus retention as a % of the loading dose was calculated. Graph shows mean ± SE of data from 6 independent experiments. (c) FACS analysis for Jam-1 expression on iDC, mDC and T cells; representative of 4 independent experiments. (d,e) FACS plots showing reovirus retention following blocking of the carrier cells with anti-Jam-1 antibody prior to reovirus loading (d), and removal of sialic acid from the carrier cells prior to loading (e); representative of 4 independent experiments.

