Figure 5.

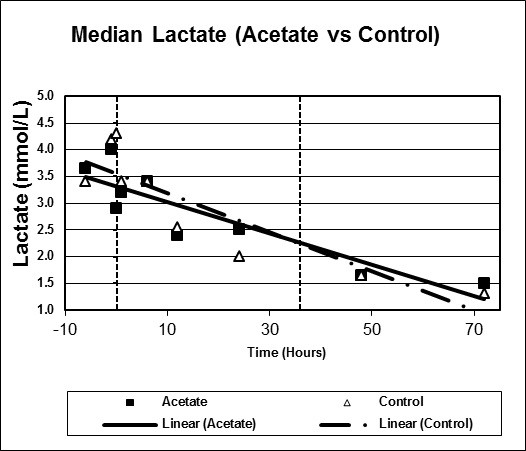
Scatter plot of median lactate, study versus control arms. Start time (0 hours) and mean infusion time (38 hours) noted with vertical lines. Regression lines plotted with p-value 0.792.

Scatter plot of median lactate, study versus control arms. Start time (0 hours) and mean infusion time (38 hours) noted with vertical lines. Regression lines plotted with p-value 0.792.