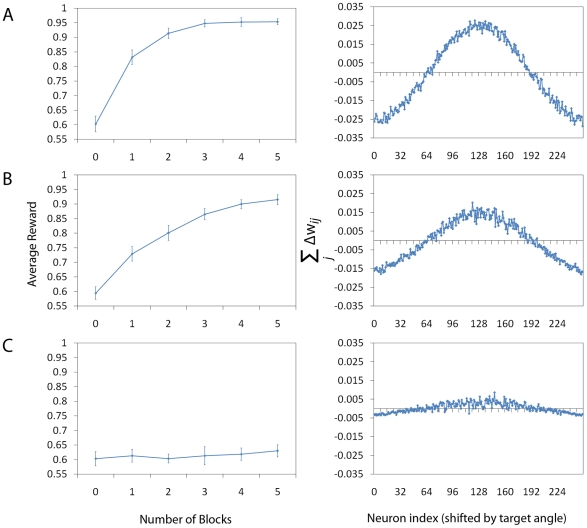
Figure 3. Analysis of System Performance.
Panels A–C (left column) show the average performance of 16
animats calculated in the following way. Every animat completes a
number of blocks of 512 trials (the number here varies from 0 to 5),
with weights being updated at the end of each trial. We term these
“blocks of learning trials”. In these figures, 0 blocks
of learning trials means that no learning has taken place. The
average reward is calculated independently from the blocks of
learning trials. Following a block of learning trials, the animat
performs of 128 independent (analysis) trials with learning being
disabled, based on which the performance of the system is evaluated
(mean reward over a total of 128x16 samples). The parameters for
systems A–C are the same as in the previous figure (i.e. A: no
lateral connections, B: lateral connections and C: very strong
lateral connections). We note that the system without lateral
connections achieves 70% of reward twice as fast as the
system with lateral connections. The system with strong lateral
connections completely fails to learn the task. We can obtain a
better understanding of the difference between the three systems by
plotting the gradient term for each case correspondingly (Panels
A–C, right column). We calculate the gradient numerically by
summing the value of the potential weight change (before learning
where the potential change is maximal)
 over
Place Cell index
  and by
shifting the index
  of the
Action Cell population so that the peak will always appear at the
middle of the graph. To achieve a smooth graph, we average over a
total of
  trials. We note that the gradient is larger when lateral connections
are absent.

