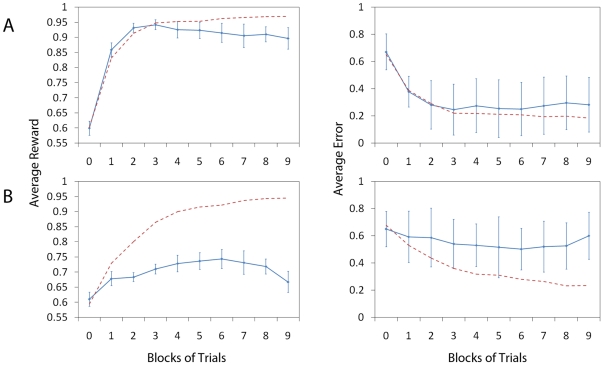
Figure 6. Additive Synaptic Noise.
Figure shows the effect of additive uniformly distributed synaptic
noise on the network performance by setting
 (see
Equation 9). Panels A and B show the network performance without and
with lateral connections (as in previous figures) respectively. The
plots of average reward (left column, solid line) are calculated as
in Figures 3 and
5 showing
learning curves over 9 blocks of 512 trials. The red dashed line
shows the values without noise from Figure 3 (systems A and B
correspond) for direct comparison. Similarly, the plots of average
error (right column, solid line) are calculated as in Figure 4. The red
dashed line shows the values without noise from Figure 4 (again, systems A and B
respectively). We can observe that both the average reward and
average error performance measures show that the system without
lateral connections is far more robust to noise applied directly to
the synaptic weight.

