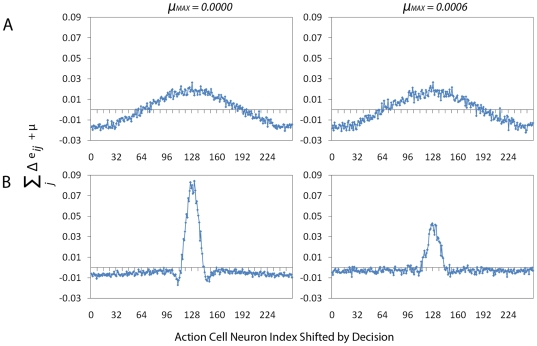
Figure 7. Noise Analysis.
To obtain a better understanding of the difference between the
performance of the two systems from Figure 6 (A: no lateral
connections, B: with lateral connections) we plotting the
eligibility trace for each case with and without an additive noise
term  . This
corresponds to
  from
Equation 9 for
 and
and  and
allows us to look at the gradient information without taking into
account the shape of reward. We calculate the eligibility trace
(
 )
numerically by summing the value of the potential eligibility trace
(before learning, where the potential change is maximal) over Place
Cell index
  and by
shifting the index
  of the
Action Cell population so that the maximum will be at the middle of
the graph. To obtain smooth curves, we calculate this value over a
total of
  trials. The left column panels show the eligibility trace without
noise. The right column panels show the the eligibility trace,
including noise (
 as in
Figure 6).
In both cases the same random seeds are used when generating spikes
and target angles to ensure both systems are presented with the same
information. The resulting right column figures therefore give an
indication of the effect of the noise. We note that the eligibility
trace of system without lateral connections is relatively unchanged
by the effect of noise, where as the system with lateral connections
results in an eligibility trace drastically reduced in
magnitude.

