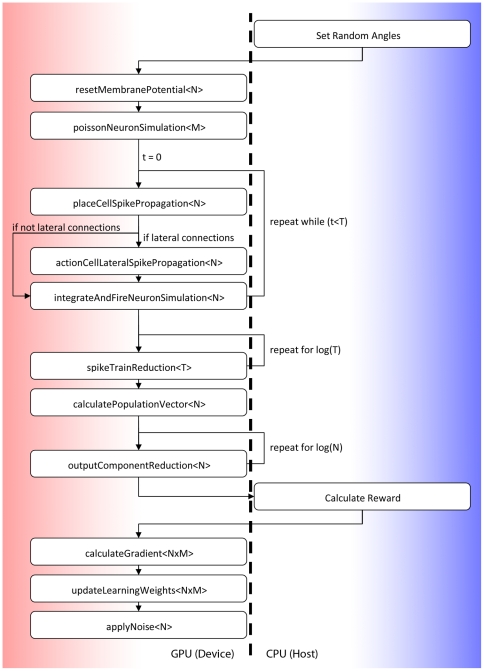
Figure 8. Simulation Flowchart.
Figure shows the simulation process of our spiking neural network model.
Steps shown on the left are broken down into CUDA kernels where the
figure in  brackets
 represents
the total number of threads which are invoked for each kernel (for
simplification this assumes only a single independent trial). The value
N represents the number of Action Cell neurons (256), the value M
represents the number of Place Cell neurons (256) and the value T
represents the total number of number of discrete time steps, i.e.
represents
the total number of threads which are invoked for each kernel (for
simplification this assumes only a single independent trial). The value
N represents the number of Action Cell neurons (256), the value M
represents the number of Place Cell neurons (256) and the value T
represents the total number of number of discrete time steps, i.e.
 (which is
 when
when
 ). Steps
shown on the right indicate calculations performed on the Host CPU.

