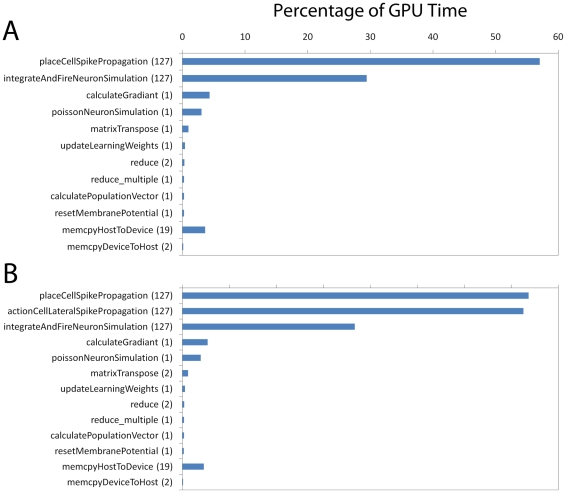
Figure 11. Performance Profile.
Figure shows the performance profile of our GPU implementation with
respect to where GPU time is spent during the simulation (shown as a
percentage for each GPU kernel corresponding with figure 8). The figure in brackets
next to the vertical axis label indicates the total number of times the
kernel function is called over single “learn step” with a
total time simulation period of T = 128 and
 . An
additional amount of CPU time is also required however this is
negligible in the scale of the overall simulation. A: Represents the
case for our model without lateral connections. B: Represents a case
with lateral connections which is the same however it includes a kernel
function “actionCellLateralSpikePropagation” which performs
the lateral spike propagation simulation.

