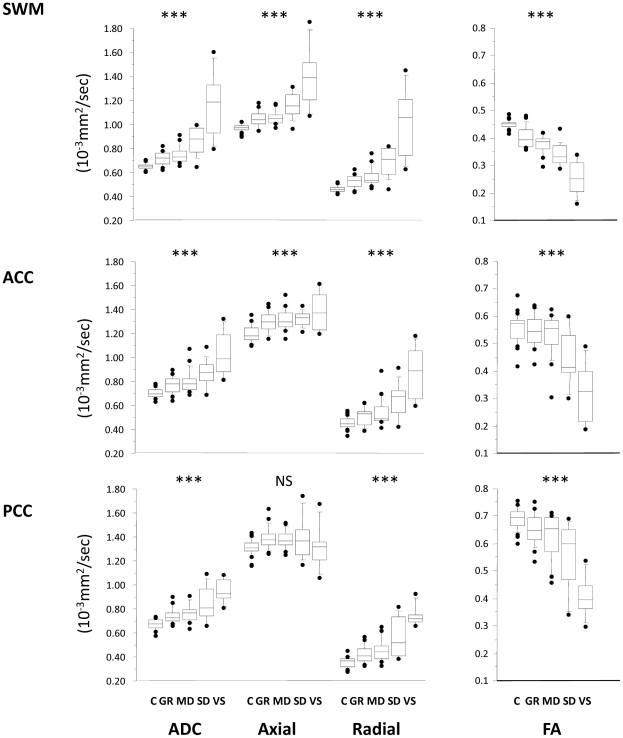
Figure 2. Trends for the ADC (left), axial, radial diffusivity and FA (right) for supratentorial white matter ROIs.
The central lines in the boxes denote the median values, the upper and lower edges the 75th and 25th percentiles, the error bars the 90th and 10th percentiles and the closed circles the data outside these percentiles. *** p<0.0001; NS, non-significant. SWM: supratentorial white matter, ACC: anterior corpus callosum, PCC: posterior corpus callosum. C = controls, GR = good recovery, MD = moderate disability, SD = severe disability, VS = vegetative state.

