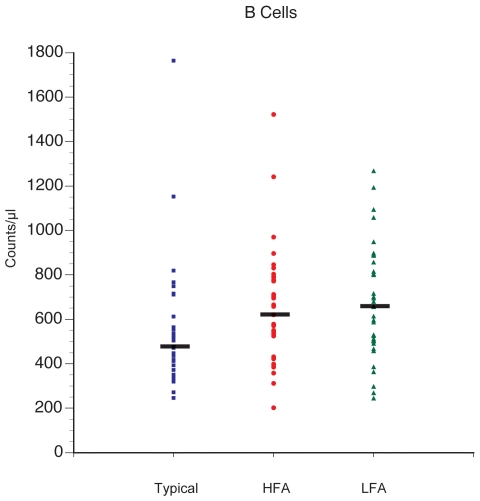
Figure 1. Average B cell counts are higher in the HFA and LFA groups compared with controls.
The absolute count values are based on 9 separate B cell assays that use CD20 as the B cell identifier. P-values = * HFA vs. N = 0.011, ** LFA vs. N = 0.009, and A vs. N 0.003. HFA vs. LFA = not significant (0.7).

