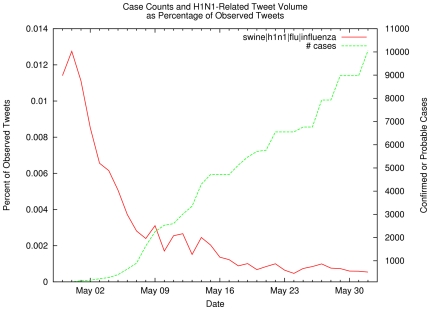
Figure 2. Case Counts and H1N1-Related Tweet Volume as Percentage of Observed Tweet Volume.
The red line represents the number of H1N1-related tweets (i.e., containing keywords swine, flu, influenza, or h1n1) as a percentage of the observed daily tweets, while the green line shows the number of confirmed or probable H1N1 cases. Note that the volume of tweets pertaining to influenza steadily declined even though the number of cases continued to grow, reflecting a lessening of public concern about the severity of the pandemic.

