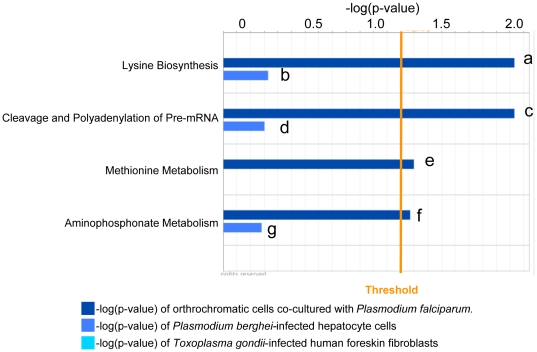
Figure 4. Comparative analysis of Cluster 2 data with infection with two organisms.
All four pathways are specifically enriched upon co-culture of P. falciparum and orthochromatic cells. Dark blue histograms illustrate statistical significance of Plasmodium falciparum-infected orthrochromatic cells (p<0.5, −log(p-value) >1.3), which is defined by the orange “Threshold” line. Light blue histograms show significance levels of enriched pathways induced upon Plasmodium berghei infection of hepatocytes; cyan represents enrichment of pathways induced upon Toxoplasma gondii infection of human foreskin fibroblasts. Genes a, alas1,ccbl1; b, vnn1; c, cpsf6,cstf3; d, cpsf6; e, alas1,ccbl1; f, alas1,ccbl1; g, pigf, mettl2b.

