
Fig. 3.
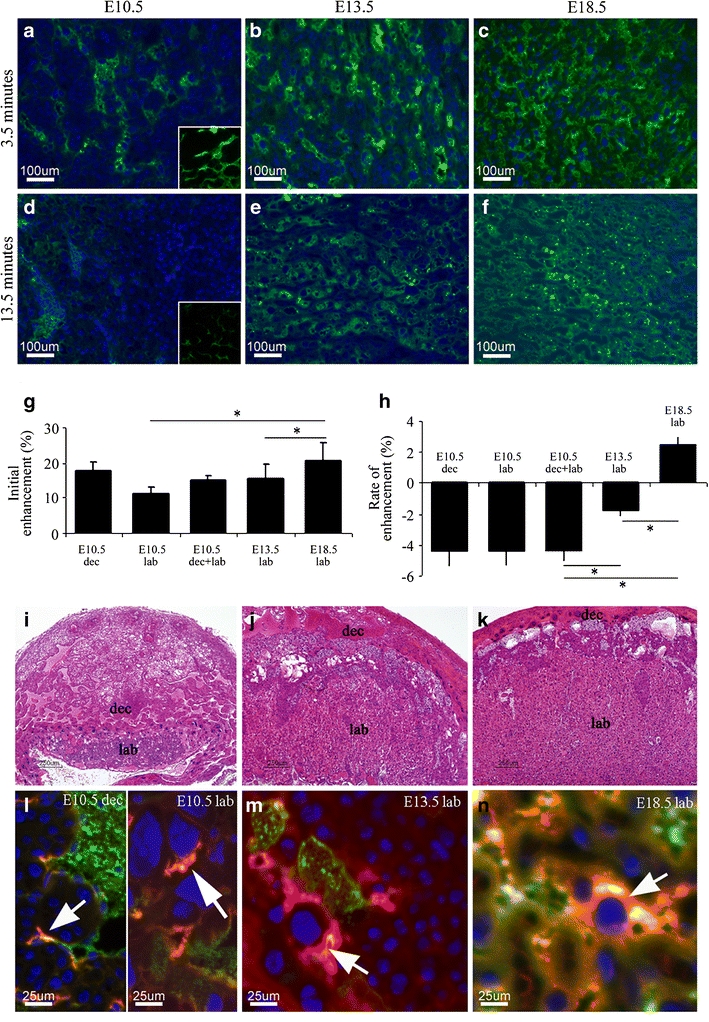
Histological analysis of maternal albumin turnover in the mouse placenta. Fluorescent images of placental labyrinth histological sections retrieved from E10.5, E13.5, and E18.5 embryos, respectively. For E10.5, the inserts are of the decidua blood pools (at the same magnification as the labyrinth) (a–f). a–c Placentas were retrieved for histology 3.5 min following tail vein injection of BSA–FAM to the pregnant mother. Blue, DAPI. Green, BSA–FAM. d–f Placentas were retrieved for histology 13.5 min following tail vein injection of BSA–FAM to the pregnant mother. Blue, nuclear staining with DAPI. Green, BSA–FAM. g Calculation of the initial enhancement inside the placenta at different developmental stages. h Calculation of the placental rate of enhancement by the fluorescent contrast agent at different developmental stages. Please note that, for E10.5, the histograms show the calculations for the labyrinth (lab) and decidua blood pools (dec) separately and the combined values of the two compartments (dec + lab). i–k H&E-stained placentas of the respected developmental stages exemplify the development of the maternal blood spaces in the labyrinth (lab) and decidua blood pools (dec). l–n Placentas were retrieved 50 min post-injection of biotin–BSA–Gd–DTPA via a tail vein (stained with avidin-Texas red) which was followed by BSA–FAM (green) injected through the same catheter 3.5 min prior to animal euthanization. Blue, DAPI. Arrows, uptake of biotin–BSA–Gd–DTPA into intracellular vacuoles detected using avidin-Texas red.