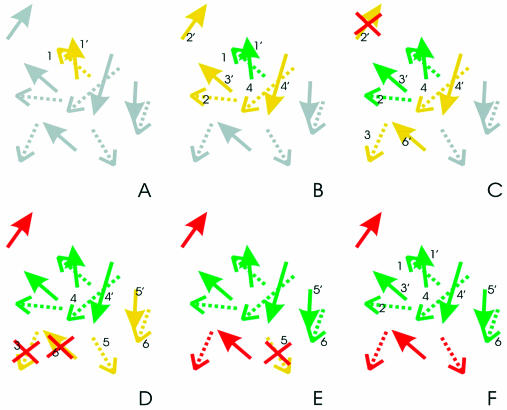
Figure 1.
The residues of the two patches P and P′ are represented as straight and dotted arrows, respectively. Each arrow describes the vector joining the alpha carbon and the pseudoatom calculated as the average coordinate of residue side-chain atoms. The colors of the arrows indicate the status of the different residues in the exploration procedure that selects the best matches between the two patches (grey: residue not yet analyzed; green: residue selected for the match; red: residue excluded from the match; yellow: neighbor of the matching residues). A red cross identifies amino acids that have just been discarded. For the sake of clarity, the two patches are always shown (from A to F) in their best superposition. Please note that, in the procedure, the best superposition is calculated for each pair of residues the algorithm explores when trying to extend the match. (A) Each possible pair of residues is evaluated. In the example the 1–1′ couple is selected to be the first pair of the match (r.m.s.d. and residue similarity better than a fixed threshold). (B) The seed pair is identified and neighboring amino acids are singled out with a distance criterion: residues 2 and 4 of the former patch and 2′, 3′ and 4′ of the latter, and are added to the neighbor list. (C) All possible associations between the neighbor residues are tested trying to extend the match. Pairs 2–3′ and 4–4′ are selected and residue 2′ is discarded. The pair 2–3′ is first added to the match. Residues 3 and 6′ are added to the neighbor list. (D) Residues 3 and 6′ are discarded, pair 4–4′ is added to the match, residues 5, 5′ and 6 are added to the neighbor list. (E) Pair 5′–6 is added to the match, residue 5′ is discarded. (F) The final match length is 4 and is composed of residue pairs 1–1′, 2–3′, 4–4′ and 6–5′.

