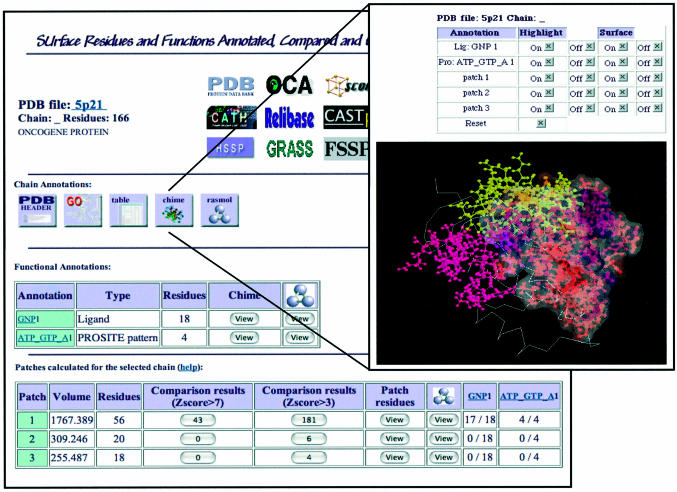
Figure 2.
In the left panel, a summary of the information on the selected protein chain is shown. A list of links to other databases is present in the upper part of the page. Four buttons link to the PDB header, GO terms and information about the selected chain annotations (in tabular and graphic format, as shown in the right panel described below). Two tables display SURFACE database data: the first table lists the annotations, the second shows the patches, sorted according to their evaluated volume. Through this last table, the user gains access to the comparison data, only those with Z-score > 7, or the longer list of those with a Z-score > 3. A graphic view of all the annotations associated to the selected chain residues is accessible by clicking on the appropriate button. On the right, the graphic display of the chain annotations can be viewed in a new page with the CHIME and RasMol plug-ins. The single patches, their surfaces and annotated residues can be labeled and displayed in colors.

