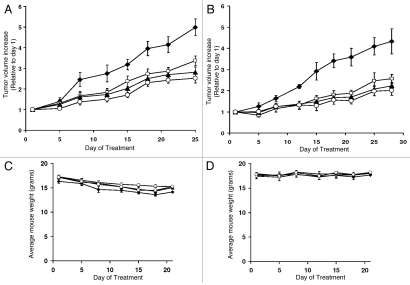
Figure 5.
Effects of SK inhibitors and sorafenib on the growth of HCC cells in xenograft models. Female SCID mice (n = 7–8 per group) were injected subcutaneously with HepG2 (A) or SK-HEP-1 cells (B) suspended in PBS. After palpable tumors were formed, the animals were treated 5 days per week with vehicle (solid squares), 50 mg/kg of ABC294640 (solid triangles), three times per week with 20 mg/kg sorafenib (open squares) or combinations (open circles). Values represent the mean ± standard error tumor volume normalized to treatment day 1 for each mouse (A and B). The corresponding average mouse weights (mean ± standard error) for the treatment groups are shown in (C and D).

